Schaffer Online Library of Drug Policy

Sign the Resolution
Contents | Feedback | Search
DRCNet Home
| Join DRCNet
DRCNet Library | Schaffer Library

Historical References

General Histories | Ancient History | 1800-1850 | 1860 | 1870 | 1880 | 1890
1900 | 1910 | 1920 | 1930 | 1940 | 1950 | 1960 | 1970 | 1980 | 1990
U.S. Consumption of Beverage Alcohol


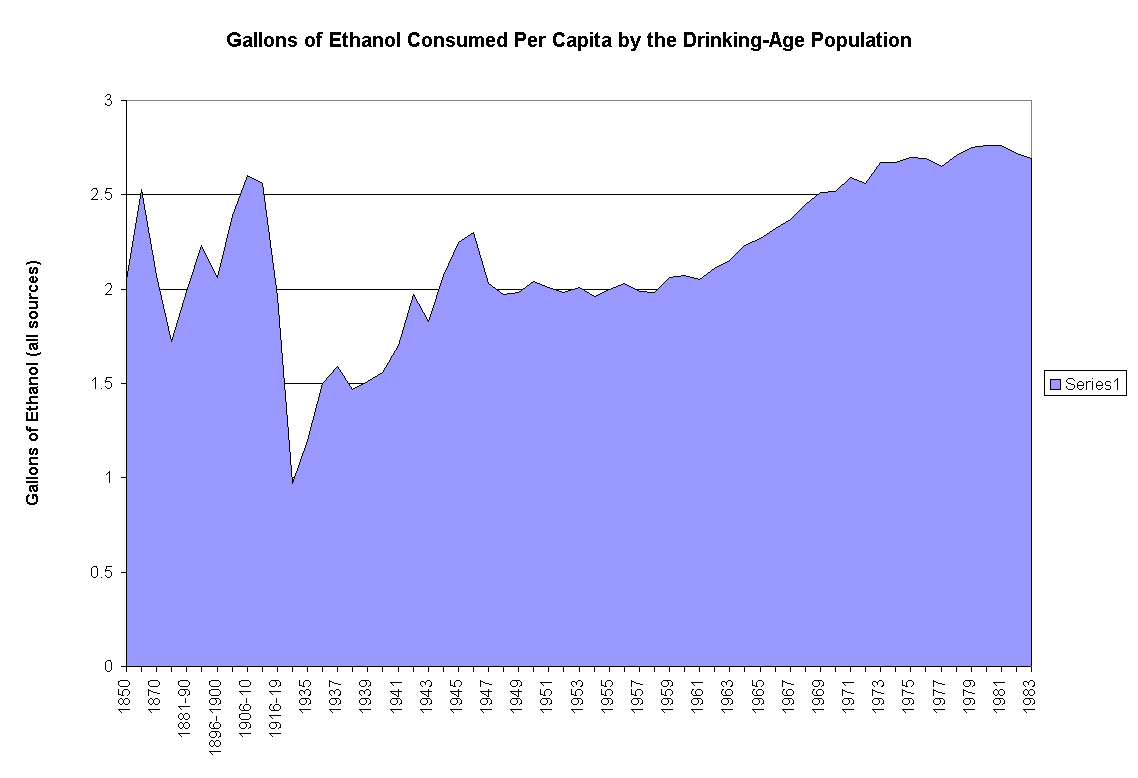
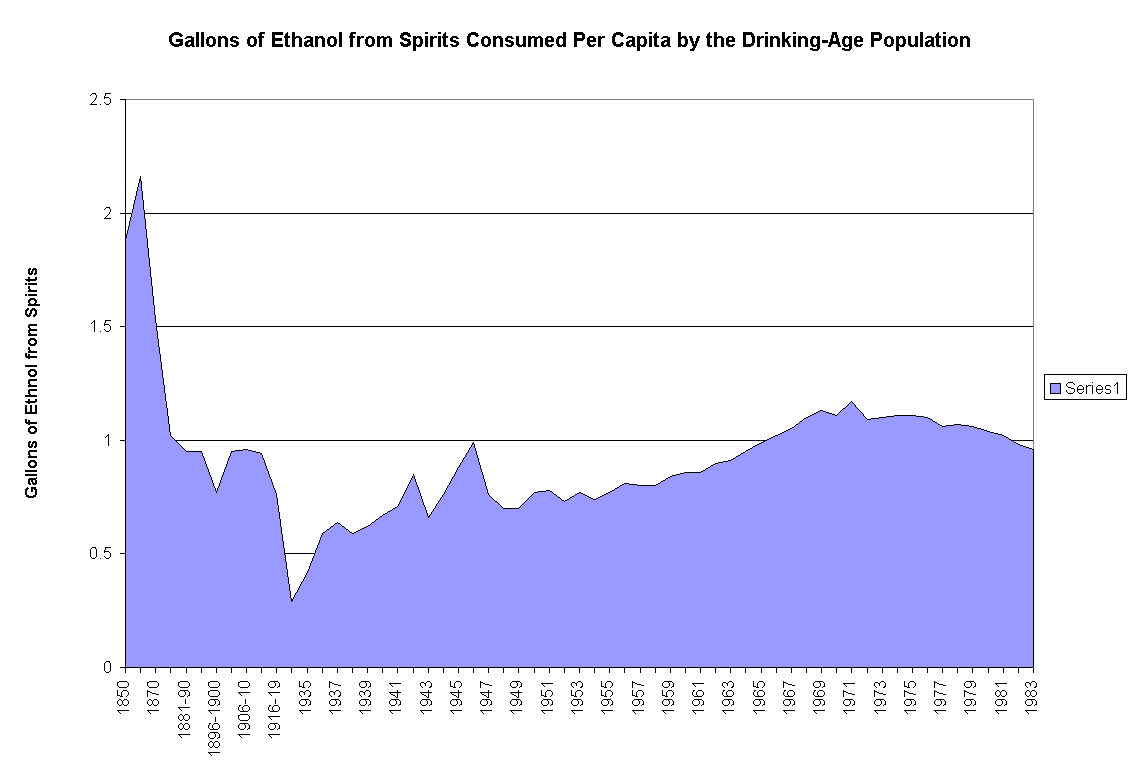
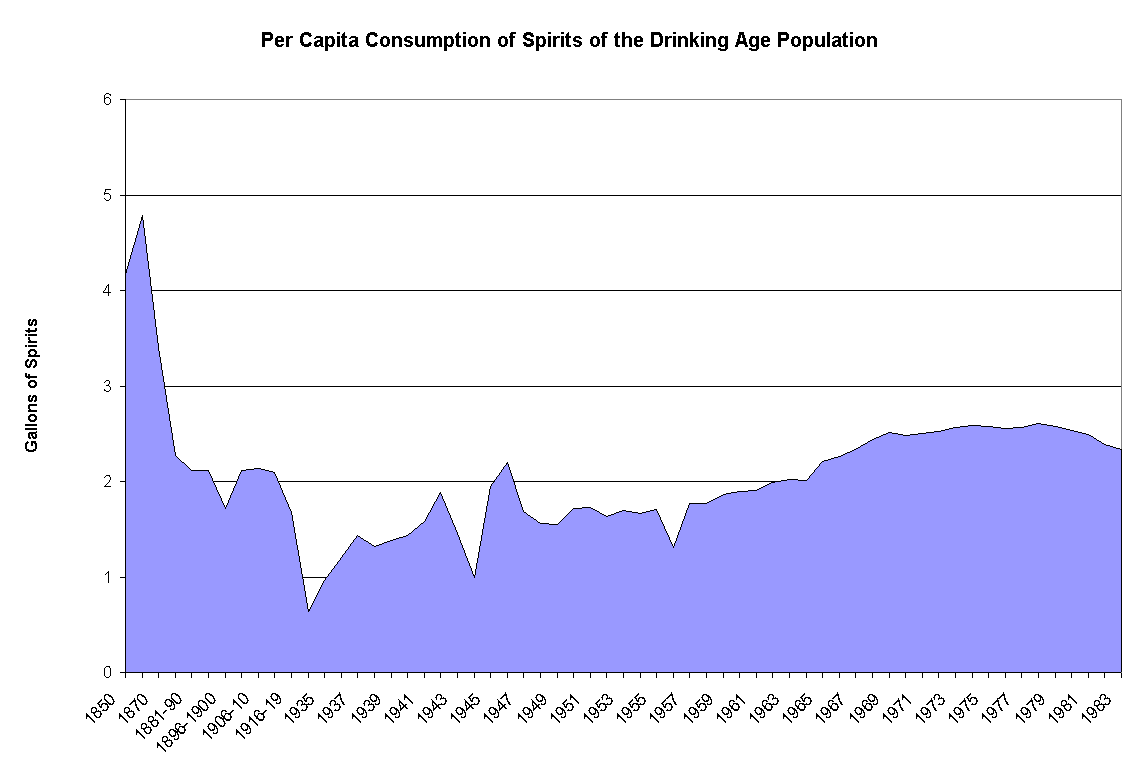
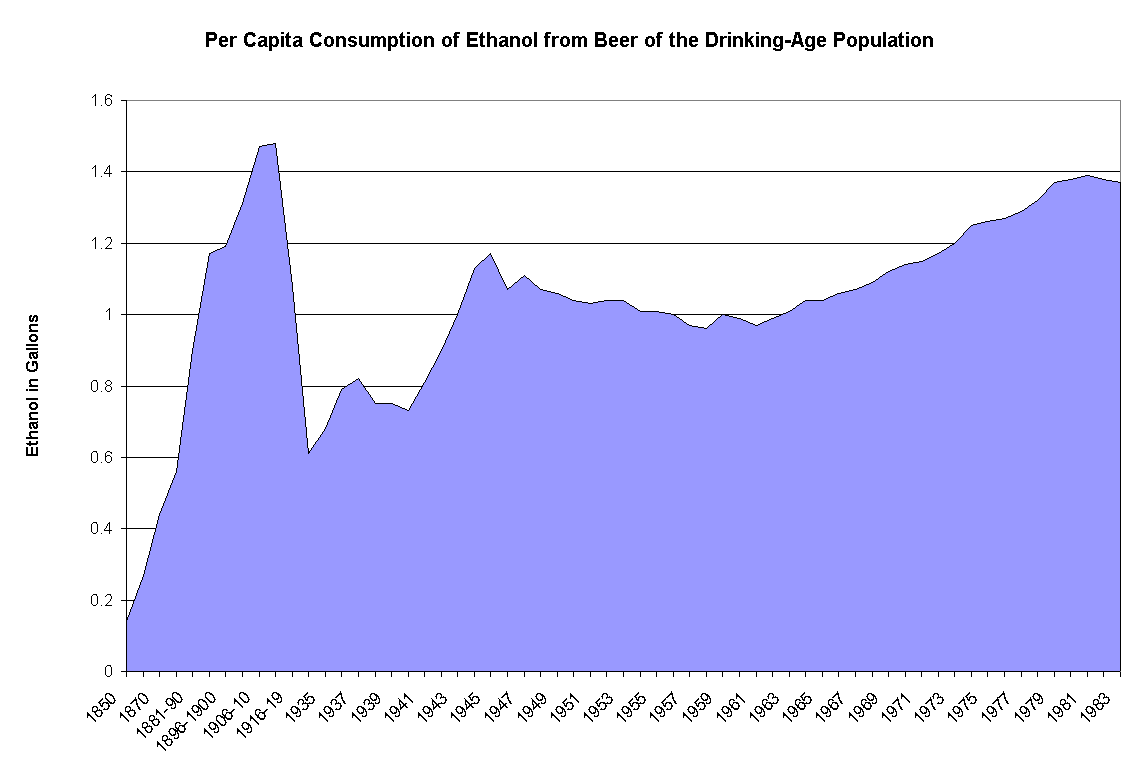
U.S. Apparent Consumption of the Drinking Age Population in Gallons per Year, 1850-1983

(Volume is expressed in gallons)

                     
  Beer     Spirits     Wine     All Beverages
Year Volume Ethanol   Volume Ethanol   Volume Ethanol   Ethanol
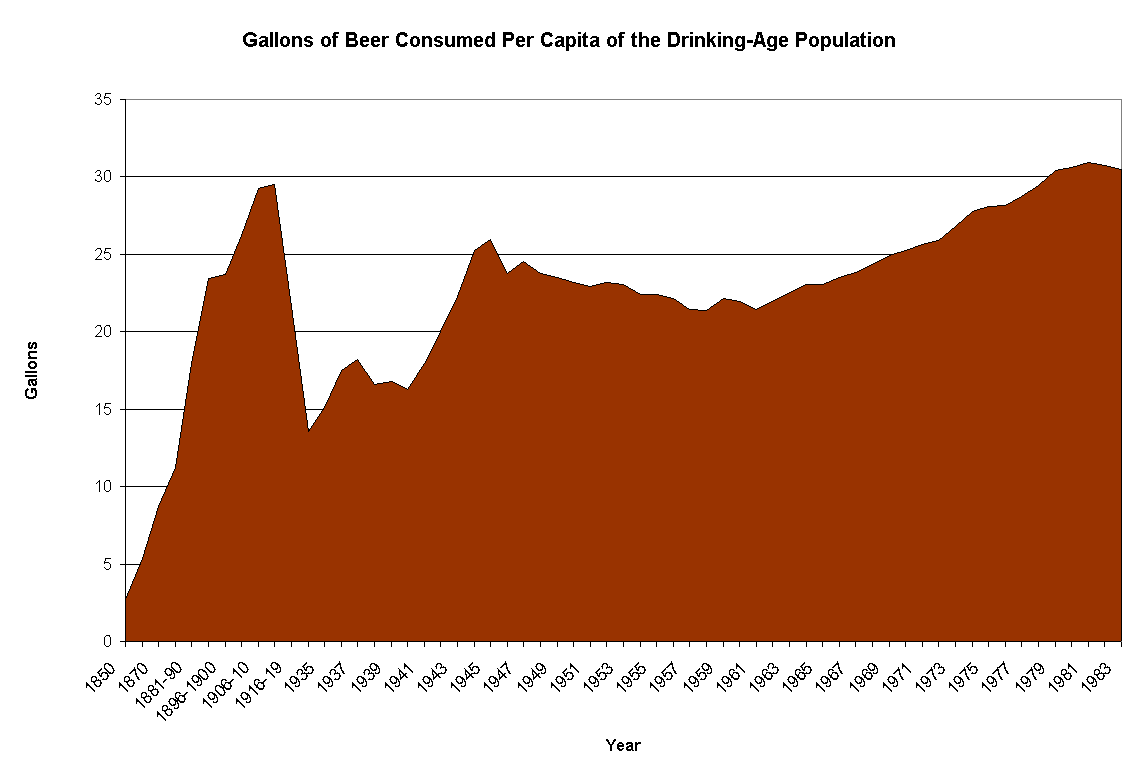
1850 2.7 0.14   4.17 1.88   0.46 0.03   2.05
1860 5.39 0.27   4.79 2.16   0.57 0.1   2.53
1870 8.73 0.44   3.4 1.53   0.53 0.1   2.07
1871-80 11.26 0.56   2.27 1.02   0.77 0.14   1.72
1881-90 17.94 0.9   2.12 0.95   0.76 0.14   1.99
1891-95 23.42 1.17   2.12 0.95   0.6 0.11   2.23
1896-1900 23.72 1.19   1.72 0.77   0.55 0.1   2.06
1901-05 26.2 1.31   2.11 0.95   0.71 0.13   2.39
1906-10 29.27 1.47   2.14 0.96   0.92 0.17   2.6
1911-15 29.53 1.48   2.09 0.94   0.79 0.14   2.56
1916-19 21.63 1.08   1.68 0.76   0.69 0.12   1.96
1934 13.58 0.61   0.64 0.29   0.36 0.07   0.970
1935 15.13 0.68   0.96 0.42   0.5 0.09   1.200
1936 17.53 0.79   1.2 0.59   0.64 0.12   1.500
1937 18.21 0.82   1.43 0.64   0.71 0.13   1.590
1938 16.58 0.75   1.32 0.59   0.7 0.13   1.470
1939 16.77 0.75   1.38 0.62   0.79 0.14   1.510
1940 16.29 0.73   1.43 0.67   0.94 0.16   1.560
1941 17.97 0.81   1.58 0.71   1.02 0.18   1.700
1942 20 0.9   1.89 0.85   1.11 0.22   1.970
1943 22.26 1   1.46 0.66   0.94 0.17   1.830
1944 25.22 1.13   1 0.76   1.03 0.18   2.070
1945 25.97 1.17   1.95 0.88   1.13 0.2   2.250
1946 23.75 1.07   2.2 0.99   1.34 0.24   2.300
1947 24.56 1.11   1.69 0.76   0.9 0.16   2.030
1948 23.77 1.07   1.56 0.7   1.11 0.2   1.970
1949 23.48 1.06   1.55 0.7   1.21 0.22   1.980
1950 23.21 1.04   1.72 0.77   1.27 0.23   2.040
1951 22.92 1.03   1.73 0.78   1.13 0.2   2.010
1952 23.2 1.04   1.63 0.73   1.22 0.21   1.980
1953 23.04 1.04   1.7 0.77   1.19 0.2   2.010
1954 22.41 1.01   1.66 0.74   1.21 0.21   1.960
1955 22.39 1.01   1.71 0.77   1.25 0.22   2.000
1956 22.18 1   1.31 0.81   1.27 0.22   2.030
1957 21.44 0.97   1.77 0.8   1.26 0.22   1.990
1958 21.35 0.96   1.77 0.8   1.27 0.22   1.980
1959 22.15 1   1.86 0.84   1.28 0.22   2.060
1960 21.95 0.99   1.9 0.86   1.32 0.22   2.070
1961 21.47 0.97   1.91 0.86   1.36 0.23   2.050
1962 21.98 0.99   1.99 0.9   1.32 0.22   2.110
1963 22.51 1.01   2.02 0.91   1.37 0.23   2.150
1964 23.08 1.04   2.01 0.95   1.41 0.24   2.230
1965 23.07 1.04   2.21 0.99   1.42 0.24   2.270
1966 23.52 1.06   2.26 1.02   1.4 0.24   2.320
1967 23.81 1.07   2.34 1.05   1.46 0.25   2.370
1968 24.33 1.09   2.44 1.1   1.51 0.26   2.450
1969 24.9 1.12   2.51 1.13   1.62 0.26   2.510
1970 25.23 1.14   2.48 1.11   1.71 0.27   2.520
1971 25.63 1.15   2.5 1.17   1.93 0.31   2.590
1972 25.91 1.17   2.52 1.09   2.1 0.3   2.560
1973 26.77 1.2   2.57 1.1   2.13 0.31   2.670
1974 27.75 1.25   2.59 1.11   2.13 0.31   2.670
1975 28.09 1.26   2.58 1.11   2.22 0.32   2.700
1976 28.14 1.27   2.56 1.1   2.23 0.32   2.690
1977 28.72 1.29   2.57 1.06   2.28 0.29   2.650
1978 29.44 1.32   2.61 1.07   2.4 0.31   2.710
1979 30.39 1.37   2.58 1.06   2.48 0.32   2.750
1980 30.59 1.38   2.53 1.04   2.63 0.34   2.760
1981 30.91 1.39   2.49 1.02   2.72 0.35   2.760
1982 30.77 1.38   2.39 0.98   2.76 0.36   2.720
1983 30.47 1.37   2.33 0.96   2.8 0.36   2.690
                     
These data are taken from

U.S. Alcohol Epidemiologic Data Reference Manual

(Vol. 1, Rockville, Md. : U.S. Dept. of Health and Human Services,

Public Health Service, Alcohol, Drug Abuse, and Mental Health Administration,

National Institute on Alcohol Abuse and Alcoholism, 1985):6

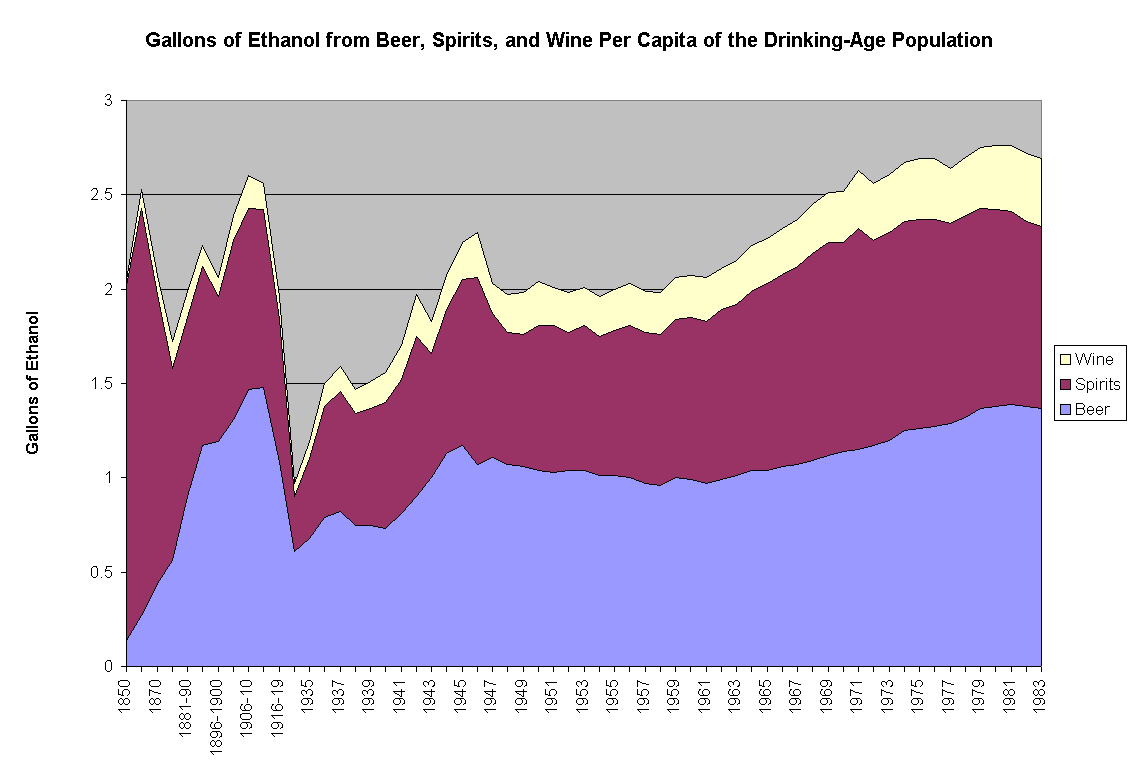
Chart Gallons of Ethanol from Beer, Spirits, and Wine Per Capita of the Drinking-Age Population

Chart Gallons of Ethanol Consumed Per Capita by the Drinking-Age Population

Chart Gallons of Ethanol from Spirits Consumed Per Capita by the Drinking-Age Population

Chart Per Capita Consumption of Spirits of the Drinking Age Population

Chart Per Capita Consumption of Ethanol from Beer of the Drinking-Age Population

Chart Gallons of Beer Consumed Per Capita of the Drinking-Age Population