Drug Enforcement Administration
![]() DRCNet Response to the
DRCNet Response to the
Drug Enforcement Administration
DRCNet Response: In order to understand the issues with methamphetamine/speed we recommend that all readers read the following chapters from the Consumers Union Report on Licit and Illicit Drugs:
Introduction
The following is a brief summary of the abuse of methamphetamine/speed as reported by emergency rooms (ERs) and medical examiners (MEs) from the Drug Abuse Warning Network (DAWN). ER data are estimates and the information is based only on data from metropolitan areas called PMSAs. Data from the suburban areas referred to as the national panel was excluded since it possibly skews the data. ME data are reported deaths from approximately 42 MEs who are located in major cities in the contiguous 48 states.
ER Episodes
There are three salient points with respect to the data. First, after normalizing for total drug episodes, it is seen that abuse is concentrated primarily in the west and southwest.
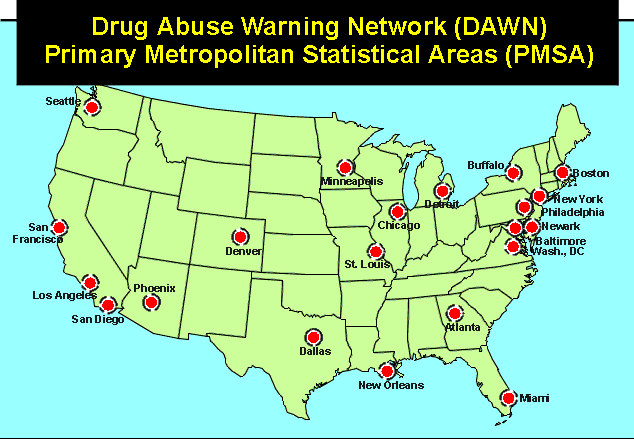
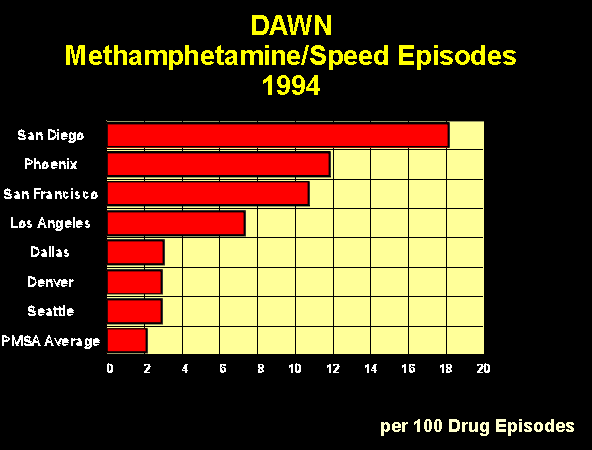
The second point is that episodes have increased significantly in the last two years. The decrease after the passage of the Chemical Diversion and Trafficking Act (CDTA) has been erased and the peak levels of 1989 have been exceeded. (Note the degree of activity in four Western cities.)
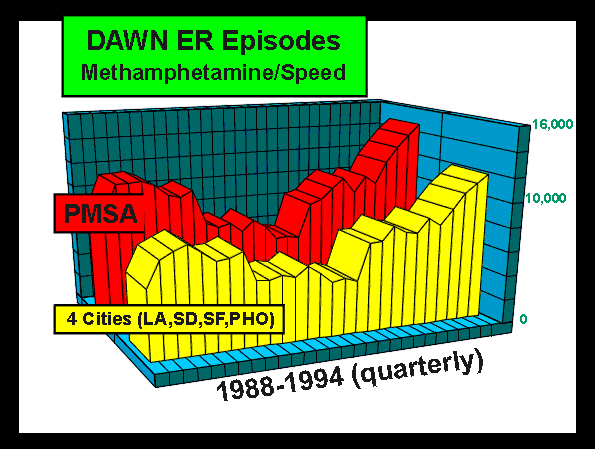
The final point concerns route of administration which shows that while injection is still predominant both snorting and smoking have increased.
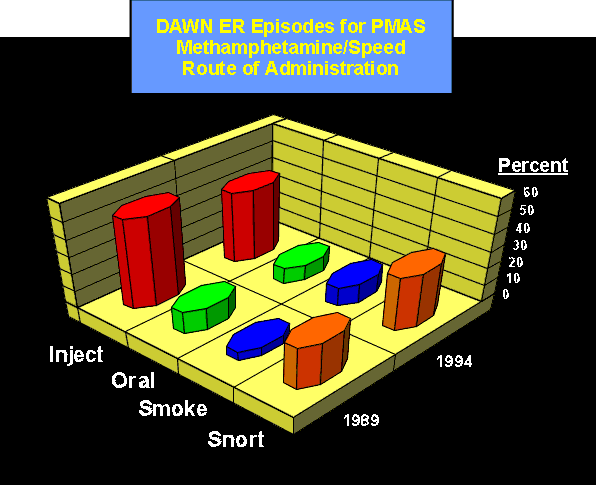
ME Episodes
Several points are noted. First, nationally deaths increased 145% from 1992 to 1994. Los Angeles and Phoenix showed the most significant increase.
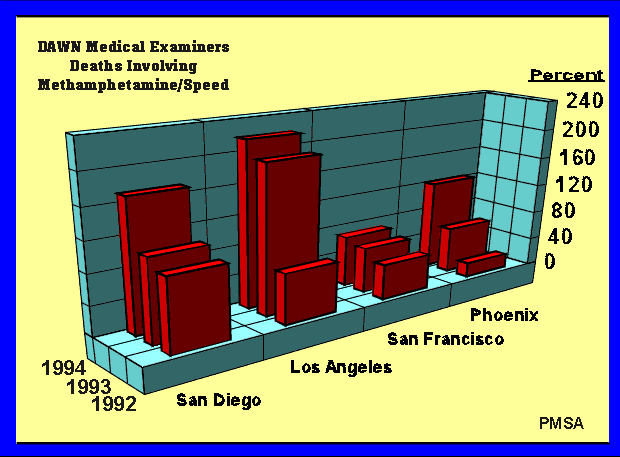
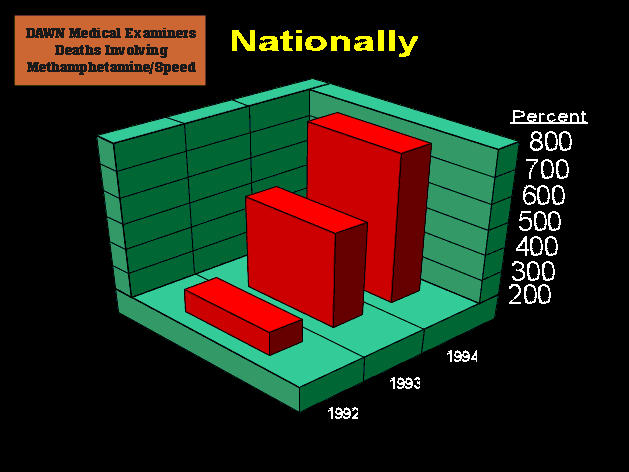
The following are some salient points with respect to the data.
| DEA Statement | Response |
| Nationally, episodes ranked seventh among controlled
substances after cocaine, heroin, codeine, diazepam, marijuana, and methadone. |
The careful reader might ask why a drug as dangerous as methamphetamine ranks seventh in "episodes" behind other drugs such as marijuana. The reason is that "episodes" means incidents in which the drug was mentioned in the case in the emergency room. It bears no real relationship to the actual cause of the problems which caused the people to go to the emergency room. It would be the same as counting tobacco in an "episode" if the patient happened to be a cigarette smoker. |
| Nationally there were 1816 episodes for the period 1991-1994. |
This obviously would not justify a major national agency such as a DEA. |
| Eighty percent or 1459 of the 1816 deaths were reported by
the areas of Los Angeles, San Diego, San Francisco, and Phoenix. |
|
| Approximately 90% of all deaths involved multiple drugs.
Those seen most often in combination were amphetamine (probably the metabolite) (71%),
alcohol (31%), cocaine (22%), and heroin (18%). Ephedrine was present in about 5% of the
decedents. |
This again distorts the issues. Tobacco is by far the most common cause of drug-related death in the United States, with alcohol second. The illegal drugs are a tiny problem by comparison, as shown by the DEA's own estimates of about 450 deaths per year -- as compared with over 400,000 for tobacco and more than 100,000 for alcohol. In point of fact, sidestream tobacco smoke kills more infants per year (about 2,000) than the number of people killed by amphetamines. See the State of California's Report on Environmental Tobacco Smoke. |
| The manner of death was predominantly reported to be
accidental (47%), while suicide was reported in only 13% of the episodes. |
|
| The characteristics of the decedents indicates the following. Most of the individuals were age 25-39 (57%). While about three out of every four (75%) were white, a substantial percentage (17%) were Hispanic. Males account for about 82% of the incidences. | |
| The following table list deaths for Los Angeles, Phoenix, San
Diego, and San Francisco for 1991 through 1994 with the percentage change for 1992 and
1994. |
As tragic as they are, in no case do these limited number of deaths show the need for an expensive national bureaucracy, particularly when compared with the much greater deaths caused by alcohol and tobacco. |
| City | 1992 | 1993 | 1994 | Change | |
| Los Angeles | 68 | 198 | 219 | 222% | |
| Phoenix | 20 | 63 | 122 | 510% | |
| San Diego | 97 | 110 | 172 | 77% | |
| San Francisco | 48 | 62 | 69 | 44% |
Questions regarding the data should be directed to the:
Drug Enforcement Administration
Public Affairs Section
700 Army Navy Drive
Arlington, VA 22202
Travel back to the DRCNet Response to the DEA Home Page
Travel back to the DRCNet List of DEA Publications
Travel back to the List of Special Issues